

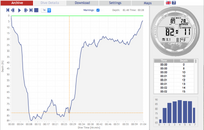
I hate to be backing up dmaziuk, but I think what he meant was if the two sampling frequencies are different, not that one is actually 20s and the other is actually 40s.I'm not sure if this is the case in this instance. Based on the Cressi Giotto user manual; Measuring field: 0-120 m, measured every second and data acquisition interval: 20 sec.
View attachment 500081

Matching Dive Computer Algorithms
Please register or login


Similar threads
