I have been intrigued by the Force Fin Blog post linked in A surprise ... and elsewhere.
It claims to prove that Force Fins were more efficient than other fins, based on tests run by the “University of Buffalo,” and sponsored by the “US Department of Naval Research.” It presents the following graph:
 After reading this, my questions (and some initial answers) were:
What the 1996 and the 2003 reports DO say and focus on, plus other works cited, are the following points:


(to be continued)
It claims to prove that Force Fins were more efficient than other fins, based on tests run by the “University of Buffalo,” and sponsored by the “US Department of Naval Research.” It presents the following graph:
- Department of Naval Research?
- There is no such organization. What is meant is the Office of Naval Research (ONR).
- What is “efficiency?”
- Less oxygen used means more efficient…i.e., if a particular speed can be obtained with a fin but using less oxygen, then that fin is more “efficient” than a fin using more oxygen
- What are fins “A” and “F”?
- What does the graph actually show?
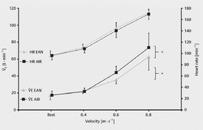
- The graph relates oxygen uptake to speed of swimming. For reference, a typical speed of scuba swimmers is about 10-30m/min. Based on this graph, the blog concludes: “…they burned less air when wearing Force Fins.” That is not obvious from the graph; at slow speeds (30m/min), three fins required the same oxygen uptake, and the Force Fin Pro required more oxygen, thus was less efficient. At even slower (untested) speeds, the graph looks like all fins would be about the same. The lab tests were designed to see how fins performed at maximal speeds and exertion levels; at the highest speed they all performed about the same, although the Force Fin Pro was marginally (but not statistically) better.
- The text in the blog, from ONR, said: “There were no statistically significant differences between the energy cost of the four fins at any of the investigated speeds.” It is not clear how the blog assertion is justified by this graph.
- How do you relate VO2/min to RMV?
- Note that a breath of air contains 21% O2, and not all that O2 is utilized before the exhalation. If it were all used, then VE (volume of exhalation) would be about 5 times VO2. However, the exhaled air typically still contains about 16% O2 (this is why CPR rescue breathing can be helpful), so in practice VE/VO2 is at least 20, often expressed in the exercise literature as 25-30 for moderate-to-intense exercise. Thus, VO2/min = 1.3 l/min on the graph is at least VE=26 l/min. In Imperial units this RMV is about 0.92 cuft/min.
- Has this work been published anywhere, or does it only exist as a Freedom-of-Information-Act request and response?
- According to the blog, the work was done prior to May 1993. In 1996, Pendergast, Tedesco, Nawrocki, and Fischer published “Energetics of underwater swimming with SCUBA” In Medicine & Science in Sports & Exercise, Vot 28, p573-580. It is attached to this post. The work -- acknowledged as having been funded by a grant from ONR -- was submitted for publication in 1994, for work over the span of a four-year grant, presumably 1991-1994, or perhaps 1990-1993. A later publication in 2003 (also attached) by Pendergast, Mollendorf, Logue, and Samimy, “Evaluation of fins used in underwater swimming” in Undersea & Hyperbaric medicine, vol 30, No 1, p55-71, had a more appropriate title and content, but was acknowledged as having been supported by the US Navy, NAVSEA, Experimental Diving Unit, not ONR; it does reference the 1996 work but apparently used similar methodology and some of the same data.
What the 1996 and the 2003 reports DO say and focus on, plus other works cited, are the following points:
- Effectively ALL tests (and in earlier work) are for the flutter kick.
- Previous studies have shown:
- a VO2/min of about 0.8 l/min at 15m/min, increasing with speed up to 2.5 l/min at 30 m/min. [Note that 0.8 l/min corresponds to an RMV of roughly 16 l/m (0.56 cuft/min), so seems quite reasonable.]
- The fin surface area is inversely related to the VO2/min, and maximal swimming speed is directly related to fin flexibility.
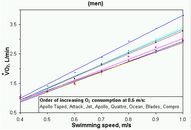
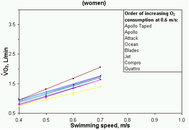
- The 1996 study looked at oxygen uptake of male divers versus fin types, normalized to distance travelled. “There were no significant differences in fin type across all subjects, however the values varied from 43 to 54 l/km. Fins with vents (A-V and B-V) were not significantly different for the same fin without vents (A and B).”
- The fins A-H were not identified as to manufacturer or type, but the characteristics of the fins were given as:
Fin D, for example, was the lightest fin tested, was deemed flexible, has the smallest surface area, and had no vents. Fin H was medium weight, flexible, relatively large, and had no vents; it was jiddle-of-the=-road in the performance plot. Fin B-V, which had the lowest oxygen uptake measured, was one of the heavier fins, moderate flexibility, a medium surface area, and had vents. The “worst” fin for energy requirements was Fin F, which was light weight, moderately flexible, one of the two largest surface areas, and had vents. No pattern for “best” is discernable.
- I speculate that Fins A and F in the chart, and in the figure immediately above, are the same A and F that are plotted in the top figure on this post. If so, Fin A is a middle of the road performer, and Fin F is the worst….but they are not statistically different.
- VO2/min is not affected by depth, so long as the swimmer is not right at the surface or the bottom.
- “It has also been shown that the energy cost of swimming was negatively correlated with fin surface area, but not flexibility, while maximal speed was negatively correlated with flexibility.”
- Fin selection affects VO2/min by as much as 25%, “with large heavy ridged fins requiring the highest VO2/min.”
- “A firm conclusion about the best types of fins cannot be made from previous studies, and many new fins designs have been marketed based on various physical characteristics without supportive data.”
The best indicator of a fin’s performance (in terms of energy efficiency) is the kick frequency;- The figure plots the kick frequency versus the Energy cost (joules per meter per kg), which says for a given body weight, the swimmer uses more energy to go the same distance if they kick faster (and takes less time to get there). The legend is for Barefoot (BF), a long, stiff fin (like the Mares Attack; LS)), a short flexible fin (like the Apollo Bio-Fin Pro SF), and a Monofin Finis (MF).
- There is an interplay between kick frequency and the depth of the kick; large, slow kicks each produce much thrust but not very often. Fast, small kicks each produce only a little thrust, but very often; it would seem that the effects have similar energy needs in terms of total thrust produced, but it doesn’t work out that way.
- The propelling efficiency is the ratio of the useful mechanical power, i.e. useful propulsion, to the overall mechanical power produced by the swimmer; it is higher for the acceleration of a large mass of water to a small speed, than it is for a small mass of water accelerated to a high speed. [This is why ship’s propellers are very large and turn slowly…]
(to be continued)
Attachments
-
 1671573555023.png51.7 KB · Views: 255
 -
 1671574215721.png45.1 KB · Views: 248
 -
 1671574257355.png38 KB · Views: 264
 -
Moller et al - EANX and exercise - 2022.pdf469.6 KB · Views: 206
-
Energetics of underwater swimming with SCUBA.pdf589.7 KB · Views: 200
-
Zamparo et al - fins.pdf272.7 KB · Views: 224
-
Pendergast etc all - Fins Evaluaton.pdf961.3 KB · Views: 187