Do you avoid people with bad sac rates?

At what sac rate do you avoid diving with someone?

  • 0.50+

    Votes: 6 18.8%
  • 0.75+

    Votes: 6 18.8%
  • 0.85+

    Votes: 4 12.5%
  • 0.95+

    Votes: 2 6.3%
  • 1.00+

    Votes: 14 43.8%

  • Total voters
    32

Please register or login

Welcome to ScubaBoard, the world's largest scuba diving community. Registration is not required to read the forums, but we encourage you to join. Joining has its benefits and enables you to participate in the discussions.

Benefits of registering include

  • Ability to post and comment on topics and discussions.
  • A Free photo gallery to share your dive photos with the world.
  • You can make this box go away

Joining is quick and easy. Log in or Register now!

SAC may vary based on stress, and stress may be a function of depth (due to narcosis, just feeling too far from the surface, or perhaps even inversely: if the deeper water is clear, with a top layer of limited viz, a diver may be more relaxed at depth).

That's my reasoning also. I've noticed on some deep dives, where I notice the narcosis, the sac rate goes in the toliet. Next dive, same depth, sac rate stays good because for some reason the narcosis isn't as bad.

The only time I ever ever had a similar sac rate to my wife is one where I actually took a nap. She was taking lots of photos of stupid little things and I got bored, I think I was out for 15 minutes which is about how long it takes me to snore, can't keep a reg in while snoring :)

So want to improve your sac? Take a nap :)
 
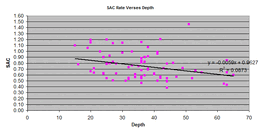
I've only started with the "dive_data.xls" file, but I already see a major flaw in the analysis. First, I deleted the max-depth-based line from the top plot, as using max depth isn't valid. Anyway, then I looked at the SAC-from-average-depth data set and noticed that the X axis was *not* average depth but rather *max* depth. That's obviously incorrect, so I went into the "source data" options for that data series and changed the X-axis source from the A column (max depth) to the B column (average depth). I also changed the plot type to plain X-Y scatter, as there's no need to connect the dots -- each represents its own individual data point. (You'd connect the dots on a profile, since the data points are parts of one curve, but when they're just a collection of data points to be analyzed, a curve implies what is not there.)

Anyway, after correcting the X-axis variable, there is *significantly* less obvious "trend" to the data. The R2 value also decreased quite a bit (i.e. the linear regression did not fit nearly so well).

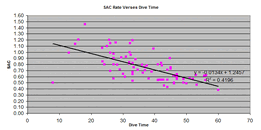
Now, given the very weak correlation, I drew upon my memory of my own 200-ish dives and wondered whether there might be something else that provides a stronger correlation. Given the data in that spreadsheet, I decided to plot SAC (based on average depth, of course) against dive time. That plot showed a far stronger correlation between dive time and SAC than the previous plot showed between depth and SAC (both are attached).

Perhaps longer dives are more comfortable dives. Perhaps edge periods (descents and ascents) require more air than bottom time does. Deeper dives have longer edge periods, so that could have something to do with the SAC vs. depth correlation. There's plenty to think about, but I'll let someone else have a turn. :biggrin:
 

Attachments

  • SACvsDepth.GIF
    SACvsDepth.GIF
    9.7 KB · Views: 55
  • SACvsDiveTime.GIF
    SACvsDiveTime.GIF
    10.1 KB · Views: 49
There's plenty to think about, but I'll let someone else have a turn. :biggrin:

No, you are doing fine:D

I wanted to write up something about O2 metabolism, CO2 production and how it triggers breathing rate, but that was in basis covered. As mentioned before SAC is affected by depth through experience. Experience controls emotions, stress and all that comes with diving in general.
 
Oh! I can't believe I forgot my big deal idea... :D

Don't forget about temperatures!

I did a pair of 20-minute dives in a very cold quarry as part of a checkout. The first dive had a SAC through the roof (far greater than I'd predicted, given the conditions and my personal evaluation of myself while doing the dive), while the second dive had the SAC I'd expected. The dives were both to 20-25 feet deep, precisely 20 minutes long, on the same tank, doing the same wall dive. They were as identical as you could possibly make them, except that on the second dive, I kept getting entangled in the dive flag line, which made me significantly more stressed at several points. I didn't notice any chilling, although considering I hadn't left the water, it's only logical that chilling would've been on the second dive more than the first (and thus would have been working against the observed SAC discrepancy). So, why did the second, stressful dive have such a lower calculated SAC than the first very relaxing problem-free dive?

It hit me after thinking about it for a few moments. When I wrote down the starting pressure for the first dive, my cylinder was warm, having been in my car up until I geared up. By the end of the first dive, however, it was at the ambient temperature of the water in the quarry. The cooling of the cylinder and the air inside it effectively increased my apparent SAC for the dive. I spent the surface interval floating, and so for the second dive, the temperature in the cylinder was effectively a constant, giving me a valid non-inflated SAC. If you've ever seen an SPG drop a couple hundred PSI during a descent into a cold lake or spring on a hot day, it's not that you're breathing really hard or that you're using a lot of BC or drysuit gas -- it's simply the temperature dropping. (From "hot car in sun" 120°F to "cold lake" 50°F, an AL80 can lose something like 400 psi! [I think I punched that in right. :wink:])

Anyway, so if you don't pre-cool your cylinders to the temperature of the water, your starting pressure will be artificially inflated. Over longer dives, that error is spread over a longer time, so your SAC isn't inflated as much. Since deeper dives tend to be longer, it follows that deeper dives would show less inflated SACs as well. It may not be that your actual air consumption is lower at all, just that you're not accounting for a significant source of systemic error.
 
berick,

Again, show me 50+ dives calculated out and plotted by depth. Two dives mean nothing.
 
As too temperature changes in the cylinders, mine are usually stored in the garage, yes in the summer they can get upwards of 90 degrees, but usually it is less than 80 in there. In the fall/winter/spring I guarentee that they are colder on the average than the water I dive in.

So now with Clayjars data we have 4 diver's data showing the reduction.

I already understand how CO2 triggers the breathing no need to explain. I would like to determine the cause of the correlation as well, I am not saying I understand it, I am just saying it appears to be there. Saying something doesn't exist when shown data that proves it does, seems a bit stubborn to me.

I also have a fifth diver's data but it had too few points to be accurate, even so it showed the correlation except on his two deepest dives where he admitted he was stressed and overbreathing because of the depth.

Mike
 
So now with ClayJars data we have 4 diver's data showing the reduction.
If you were looking at the data I posted, it was a correction of a grossly mistaken analysis in the first spreadsheet you submitted. I was not supporting your position that there is a statistically significant correlation between depth and SAC, and in point of fact, I provided an alternate explanation with a far stronger correlation (although I did not make a point to argue whether or not that correlation is itself statistically significant).

Additionally, the use of standard deviation in that spreadsheet was not valid. The data points were not repetitions of a single measurement (as a one-variable mean and standard deviation would apply to). Rather, the data points are paired values and must be analyzed as such if there is to be any value in the analysis.

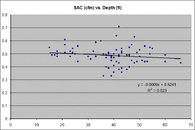
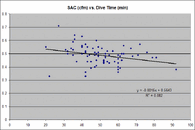
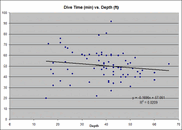
I have attached a text file with average depth, SAC, and dive time from 77 of my dives (pulled from my current logbook). In the first chart, you can see a trend line that decreases ever so slightly with depth. In the second chart, you can see a trend line that is much more strongly correlated to dive time. In the third chart, you can see that for my dives, dive time does in fact *decrease* with increasing depth. :biggrin:

It's been too long since I've actually delved into multivariable statistics. (I didn't even take a college course on it.) If we're going to keep going along these lines, we need to split off into a new thread out of courtesy to the OP. (The answer to this thread seems to be that nobody would deny a buddy just because of SAC, but I fear the corollary may be that quite a few would deny a buddy if they started throwing this much math around. :D)
 

Attachments

  • CJ77dives.txt
    950 bytes · Views: 58
  • CJ77dives-SACvsDepth.gif
    CJ77dives-SACvsDepth.gif
    7.4 KB · Views: 45
  • CJ77dives-SACvsDiveTime.gif
    CJ77dives-SACvsDiveTime.gif
    7.8 KB · Views: 47
  • CJ77dives-DiveTimevsDepth.gif
    CJ77dives-DiveTimevsDepth.gif
    8.1 KB · Views: 39
Ok...here are the data sheets and calculations. As you can see when the SAC's are arranged by depth for each diver the rates decrease with depth using a linear trend.

Mike


Mike,

When I quickly analyse the first set of data (dive_data.xls).

I would come to some very dirty and quick conclusions.

1. Avg SAC is not dependant on:
- max depth
- avg depth

2. No relationship between time and:
- max depth
- avg depth

3. Avg SAC is dependant on time or time is dependant on avg sac

I am assuming none of the dives were stopped due to too little air remaining.

4. relationship between time and sac does not give the whole picture (there are other causes)

5. The longer the time the lower the avg SAC or the lower the avg SAC the longer the time

6. there appears to be a order effect in the dives. (Are these 80 something dives in chronological order? What seasons do they span? What are the dive numbers for the diver (dives 50 to 130 or dives 1000 to 1080)?, Did the diver get a new drysuit?)


Conclusions as of the cause for longer dive time equals lower avg sac?

Some quick ideas:
- Temperature effect on tanks (mentioned before)
- Is the person getting cold during the dive and does time really represent water temperature? Ie. colder water equals higher sac and shorter dives?
- X
 
Stop and think a moment...if I have longer dive times with the same size tank....gee maybe my SAC will decrease? :)

Ok, grossly mistaken, how so? I know MAX depth doesn't really mean anything, but some souls only record max depth, not everyone has dive computers. I was just messing around with the SD, didn't really mean it as part of the analysis in the spreadsheet. The most important lines where the average depth numbers and the linear least squares line approximation.

Mike
Mike
 
The dives are in depth order, not time order. I don't recall any of the dives being called due to temperature (on my part, I usually dive dry when it gets cold, maybe one or two because of my dive partners, but that wouldn't affect my SAC).

Some are short because I was using up a tank, a dive buddy called the dive, or other reasons that probably didn't affect the SAC.

Some where stressed, others were not (hence averaging the numbers using linear approximation to smooth these outlayers).

Of course to get better data one would use a compression chamber and use good flow rate and volumetric measurments at various pressures with a person doing light exercise for an exact time period. Then the results would really mean something. This was just something I noticed in the data.

Mike
 

Back
Top Bottom