

Slamfire
Contributor
I would like to be able to graph M-Value Relationships for individual decompression profiles I plan. I am using Z-Planner with Buhlmann's ZHL16b to do the planning, but a little more info on were my % M-Value gradients are stacking up for the 16 different Buhlmann tissues would be informative.
I've looked around the web for something out there but I have not been able to find it. Does anybody know if there is something available out there?
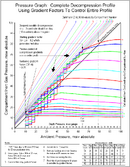
I am attaching a sample image of the kind of graph I'd like to reproduce for my deco profiles. This sample image is from Erik Baker's paper on "Clearing up the Confusion About Deep Stops". Thanks in advance for your help.
I've looked around the web for something out there but I have not been able to find it. Does anybody know if there is something available out there?
I am attaching a sample image of the kind of graph I'd like to reproduce for my deco profiles. This sample image is from Erik Baker's paper on "Clearing up the Confusion About Deep Stops". Thanks in advance for your help.