Question about Nitrogen loading bar graph verses NDC minutes

Please register or login

Welcome to ScubaBoard, the world's largest scuba diving community. Registration is not required to read the forums, but we encourage you to join. Joining has its benefits and enables you to participate in the discussions.

Benefits of registering include

  • Ability to post and comment on topics and discussions.
  • A Free photo gallery to share your dive photos with the world.
  • You can make this box go away

Joining is quick and easy. Log in or Register now!

GaryBDavis

Contributor
Messages
174
Reaction score
21
Location
Andice, Texas
# of dives
50 - 99
I just dove my first two dives with my new air integrated Oceanic VT4. My previous computer was the Atmos ai (also air integrated). So, similar computers but the Atmos ai shows the lesser of ATR and NDC minutes whereas the VT4 shows both separatedly.

I was diving nitrox 32 on two fairly deep (around 80 feet) dives with about an one hour surface interval. Towards the end of the second dive, the nitrogen loading bar hit four of five bars and set off the alarm (which I had provisioned). Now the next bar (the fith bar) is a decompression voilation, so I don't have anymore visual indications or warnings before I hit the NDL limit. So, we began a slow ascent and ended the dive with around 1000 PSI left. When I hit the fourth bar of the NDL limit, I noticed that I had about the same number of NDC minutes as I had ATR minutes remaining.

So, the question I have is in this situation, should I have extended my dive another 10 minutes - keeping my eye on the NDC and ATR minutes and not worried about the NDL bar being so high? Can I correctly assume that the NDL bar graph will hit the fith and last bar when the NDC minutes gets down to zero? From what I read, both the NDL bar and the NDC minutes take into account the previous dive nitrogen loading plus and SI and will adjust the readings according.

I realize that I could have gone up 20 feet or so to combat the nitrogen loading, but there just wasn't anything to see at that depth so I just decided to play it safe and end the dive. Afterall, it was the first time with a new computer.
 
Last edited:
I have the Oceanic Prodigy which also shows a nitrogen loading bar graph as well as the no deco time. The bar graph shows the nitrogen loading of the maximally loaded tissue compartment and when mine goes into red zone the no deco time is zero. I think the same principle applies to your VT4.

The nitrogen loading graph allows you do dive more conservatively, for example when my graph goes into yellow zone (or yours goes to 4 bars) I can choose to ascend to prevent further on gassing without waiting for the no deco time to go to zero. It's also useful after your dive to see what your nitrogen loading is and how it's decreasing-- the equivalent to residual nitrogen time when table diving.

Adam
 
Can I correctly assume that the NDL bar graph will hit the fith and last bar when the NDC minutes gets down to zero?

The NDL time will count down. 3 minutes,2,1,0. Will stay at zero for 59 seconds then switch over to deco mode .At that point the bar graph will also enter deco mode. (And will probably be red)

The above assumes you are at constant depth.

Knowing how your computer will behave on a dive is a real good idea. :wink:
 
The NDL time will count down. 3 minutes,2,1,0. Will stay at zero for 59 seconds then switch over to deco mode .At that point the bar graph will also enter deco mode. (And will probably be red)

Thanks for the details. BTW, where did you find this? I took the on-line class and read through the manual but didn't find this level of detail.
 
The NDL time will count down. 3 minutes,2,1,0. Will stay at zero for 59 seconds then switch over to deco mode .At that point the bar graph will also enter deco mode. (And will probably be red)

The above assumes you are at constant depth.

Knowing how your computer will behave on a dive is a real good idea. :wink:

You might want to check on that zero value. I was looking at one of the older oceanic computer simulations and the value 1 seemed to represent 1 to 60 seconds and then it went into deco.
 
Thanks for the details. BTW, where did you find this? I took the on-line class and read through the manual but didn't find this level of detail.

I've been using an Aeris computer for some time. It's been along for the ride on a lot of deco dives.

You might want to check on that zero value. I was looking at one of the older oceanic computer simulations and the value 1 seemed to represent 1 to 60 seconds and then it went into deco.

Not sure I follow this. I know my computer will display "0" NDL for some time before rolling over into deco. Always assumed that "0" really is 0.99, 0.98 etc. (Presumably it will not round NDL time up as that would not be "safe" . )

But this is missing the forest for the trees. It makes no practical difference if the NDL time is 1 minute, 0 minutes or you are just into deco. All of these imply a significant N2 loading and require an appropriate ascent.

Deco is not a binary deco/no deco situation, even though a computer display makes it seem that way.
 
.....When I hit the fourth bar of the NDL limit, I noticed that I had about the same number of NDC minutes as I had ATR minutes remaining....
This is just a coincidence

......Can I correctly assume that the NDL bar graph will hit the fith and last bar when the NDC minutes gets down to zero? .....
Correct. The NDL bar graph and the NDC minutes are two different ways to express the same concept: how close you are to get into deco. The NDL bar expresses it in % while the NDC is in minutes.

The NDL time will count down. 3 minutes,2,1,0. Will stay at zero for 59 seconds then switch over to deco mode .At that point the bar graph will also enter deco mode.....
Thanks for the details. BTW, where did you find this? I took the on-line class and read through the manual but didn't find this level of detail.
That is how decompression algorithms - and dive computers - work :wink:

To help divers better understand how dive computers and deco algorithms work, we have designed the online class Introduction to Dive Computers and the dive computer simulator divePAL
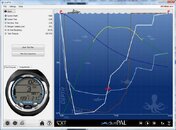
As an example, in the image below, I took the VT4 for an aggressive dive and at ~10 minutes into the dive, the VT4 has 4 bars in the NDL bar graph and 3 minutes NDC. divePAL shows this with more details: the NDL load is at 95% - and clearly in the yellow zone - and NDC is at 2:26.

divepal_w_vt4_20111002.jpg

In summary ..... dive computers have a limited real estate available (screen size) so they have to compromise a bit on how much details they can present.
It is important to understand how your dive computer shows data, but it is also VERY IMPORTANT to understand what is "under the hood" (how deco algorithms work)
 
Thanks for all the helpfull replies. I need to run a few dives through the dive simulator. I got a free trial for it with my purchase, so I need to take advantage of it. Anytime you plan to dive profile that you've never done before or haven't done in a while, running through the simulator a few times would be good planning. I guess that's why someone thought of producing a simulator!

The NDL is just a simple bar graph with a 20% granularity, so it's going to show four bars when I'm in the 80 to 100% range. I think I'd like to see a percentage reading similar to the O2 loading. Still, the NDC is on my main display, so that's what I'll watch. NDC, ATR and tank pressure are the keys.
 
https://www.shearwater.com/products/peregrine/

Back
Top Bottom