chatGPT Bühlmann ZHL-16C graph

Please register or login

Welcome to ScubaBoard, the world's largest scuba diving community. Registration is not required to read the forums, but we encourage you to join. Joining has its benefits and enables you to participate in the discussions.

Benefits of registering include

  • Ability to post and comment on topics and discussions.
  • A Free photo gallery to share your dive photos with the world.
  • You can make this box go away

Joining is quick and easy. Log in or Register now!

Papyone

Contributor
Messages
71
Reaction score
30
Location
Belgium
# of dives
Hi,
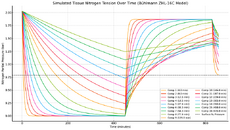
a few days ago I asked chatGPT if he could make me a simulate tissue tension graph based on Bühlmann ZHL-16C model for the following hyperbaric situation in a DRY pipeline.

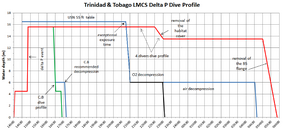
Time: 00h00 start pressurisation

Time: 00h01 absolute pressure 2,57 bars

Time: 08h00 start depressurisation from 2,57 bars to 2,37 bars

Time 08h30 arrival at 2,37 bars

Time 14h30 start decompression from 2,37 bars to 1 bars

Time 15h00 arrival at 1 bars (surface)

I received this graph from the IA, but it looks a bit strange that the curves start from the top at 2 bars. I know that chatGPT is not yet always right that’s why I would like have your opinion about this graph.
 

Attachments

  • graph chatgpt.png
    graph chatgpt.png
    222.9 KB · Views: 21
Did it generate the graph via code or image generation?
 
My question is, did you give it a picture and it returned a picture (jpg, png..) or numerical data (csv, json, xls)

Chatgpt is much more likely to hallucinate when processing images not words/numbers

Ask it to explicitly plot the tissue saturation via python, or to output it in a csv file and then plot it) and see if it still gives the same result
Well as I said I did show him that picture (see previous reply). I will try to ask him in one of the other formats you recommend. Do by chance some guy’s here on this forum could generate such a graph?
 
- I'd not rely on ChatGPT for something that you can't verify the correctness yourself (I first reacted with "Funny" as I really though you were mocking overreliance on ChatGPT). The probability that it hallucinates something is quite high, and if you can't check, you can be mislead. AI tend to be very bad at recognizing that something is out of their depth, far worse than most people, so they'll always give you an answer, at best obviously wrong, at worst plausible for someone lacking the needed background but is deep into Pauli's "Not even wrong" bucket.

- Related to my point of AI lacking awareness of their own limitation, I'm strongly aware that the profile is outside what I'm familiar with. I fear that is outside of the domain in which Bühlmann ZHL-16 has been validated and that slower compartments than those in the model could be relevant. I'm not sure what you can do here without taking the advice of an expert who can vet the validity.
 
Well as I said I did show him that picture (see previous reply). I will try to ask him in one of the other formats you recommend. Do by chance some guy’s here on this forum could generate such a graph?

You might like to check the times and pressures, but this seems like what you're looking for
 

Attachments

Back
Top Bottom