Cell linearity checks

Please register or login

Welcome to ScubaBoard, the world's largest scuba diving community. Registration is not required to read the forums, but we encourage you to join. Joining has its benefits and enables you to participate in the discussions.

Benefits of registering include

  • Ability to post and comment on topics and discussions.
  • A Free photo gallery to share your dive photos with the world.
  • You can make this box go away

Joining is quick and easy. Log in or Register now!

rjack321, I’m still not getting this…

I’m OK with this part:
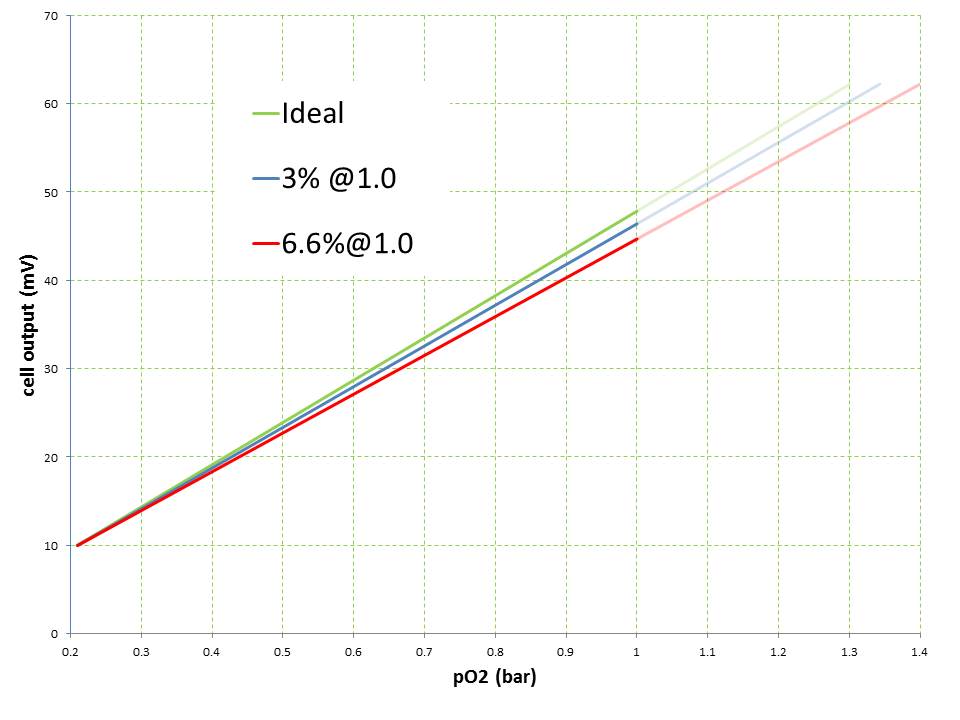
Imagine a cell's mV is 3% less than ideal at a 1ata, ppO2 = 1.0 during calibration.

Go up from your 100% calibration point to a ppO2 of 1.3 and that 3% is magnified. The distance between red and green is getting bigger the further away from the 100% calibration point you get.
(assuming both lines are perfectly straight (but not parallel))

But this part is eluding me:
A deviation of more than 3% between ideal and expected for this kind cell in 100% O2 at calibration will mean that you will get 1.3 on your handset but the true O2 is at ppO2 of 1.4

If, say, 0.209=10mV the ideal at 1 would be 47.847mV. A 3% deviation (low) at this point would be 46.412mV. Extrapolating then; at 1.3 the ideal mV would be 62.2 and the ‘fading’ cell would be 60.2. This is still <3.5%. The difference between 1.3 and 1.4 is 7.7%, which is why I asked if your 3% drift at 100% cal was meant to be 3mV (which would give 58.1mV at 1.3 against a target ideal of 62.2, and produce the 0.1 difference on pO2). Would you not need a deviation nearer 7% at 100% cal to give 7.7% at 1.3 (and the false 1.4 readout)?

All this is assuming the cells read same mV at 0.209 (1ata).

P.S. your graph shows the fading cells as reading higher mV than the ‘ideal’ line for the same pO2. I would expect a fading cell to be on the opposite side of the ideal line (above it on your graph) and read a lower mV for same pO2. Are the axes mislabelled (mV should be the ordinate)?
 
rjack321, I’m still not getting this…

I’m OK with this part:

(assuming both lines are perfectly straight (but not parallel))

But this part is eluding me:


If, say, 0.209=10mV the ideal at 1 would be 47.847mV. A 3% deviation (low) at this point would be 46.412mV. Extrapolating then; at 1.3 the ideal mV would be 62.2 and the ‘fading’ cell would be 60.2. This is still <3.5%. The difference between 1.3 and 1.4 is 7.7%, which is why I asked if your 3% drift at 100% cal was meant to be 3mV (which would give 58.1mV at 1.3 against a target ideal of 62.2, and produce the 0.1 difference on pO2). Would you not need a deviation nearer 7% at 100% cal to give 7.7% at 1.3 (and the false 1.4 readout)?

All this is assuming the cells read same mV at 0.209 (1ata).

P.S. your graph shows the fading cells as reading higher mV than the ‘ideal’ line for the same pO2. I would expect a fading cell to be on the opposite side of the ideal line (above it on your graph) and read a lower mV for same pO2. Are the axes mislabelled (mV should be the ordinate)?

Sorry I had a typo
Green and red are diverging so 3% at your ppO2 of 1.0 calibration point is getting larger the higher your ppO2.

I was taught 3% of mV at 1.0
Narced uses 2% of ppO2 in their pot guidelines but throughout the entire 1 to 2 ppO2 range.

Either way the point is that not all cells fail like the purple droop. And good catch I mislabeled my axes! I will reverse those :D
 
Just re-reading this and wanted to check something, why can't a rough check of the mv at design set point be used to verify if there is s significant deviation from linear.

Given that the cells only measure o2, regardless of whether the o2 is present from the dil content or the solenoid/leaky valve the mv should tally, assuming the caveats regarding loop vapour etc. are respected.

I get that this wouldn't give the precision required of a true linearity check, but could be an indication of an impending problem
 
I was taught 3% of mV at 1.0

I think it's around 6.6% at pO2=1 to get a cell reading 1.4 at same mV where an ideal would be 1.3. See the attached graph.
Either way the point is that not all cells fail like the purple droop.

Agreed :D. That's the main point. I think you've helped clear up the difference between 'linearity', 'current limited' and 'drift'.
 
Just re-reading this and wanted to check something, why can't a rough check of the mv at design set point be used to verify if there is s significant deviation from linear.

Because there is no way to get a precise (known) loop contents and precise enough depth to see these relatively small departures from the desired slope. From a practical perspective on a dive you can only see that they don't spike above ~1.4 or 1.5 because of the purple drop off in mV. If cell output hasn't gotten that bad yet you are looking for modest but concerning deviations for "perfect" 1:1 linearity at the highest ppO2 you can get which is only 1.0. If I get a cell which is 3% off from expected mV at 1.0 I'm going to put it in the pot and make sure its not just me (wiring, corrosion, didn't get 100% in there before calibrating, etc) before going on a dive at all. If the cell is 75hrs and 11months old it's probably just getting old and tired. But the loss of 1:1 slope is a hint that maybe I have a failed cell that an in-water spike would reveal as a failure. Better to find that out ahead of time and replace the cell as needed.
 
Thank you it seems to be a tricky area, 80 voters in this poll suggested that they completed in water linearity checks alongside current limiting checks which in this context of this thread seems erroneous.

CCR Explorers Discussion Group Public Group | Facebook
Sorry but that doesn't link to a poll. Can you see the date so I can find it? NVM found it, Nov 4th 2019.

And based on the responses in comments almost all of them are talking about testing for a purple droop in the water. Larry and a few other are talking about testing for red type cell degradation in a pressure pot or at calibration. Michael Blake Thorton is also correct in that thread, there are two type of "failures" going on. Loss of linearity like my red line and loss of output (and linearity) like my purple line.
 

Back
Top Bottom