


Heat graphs are NOT decompression information. On / off gassing charts are NOT decompression information. Heat graphs do not show Supersaturation! Once again Kevin, you have confused your terms. your graphs do not show supersaturation.
On / off gassing make pretty charts, but is NOT decompression information.
***********************************
Here is a real chart of actual decompression supersaturation limits. This data (actual supersaturation) is superior to on/off gassing data.
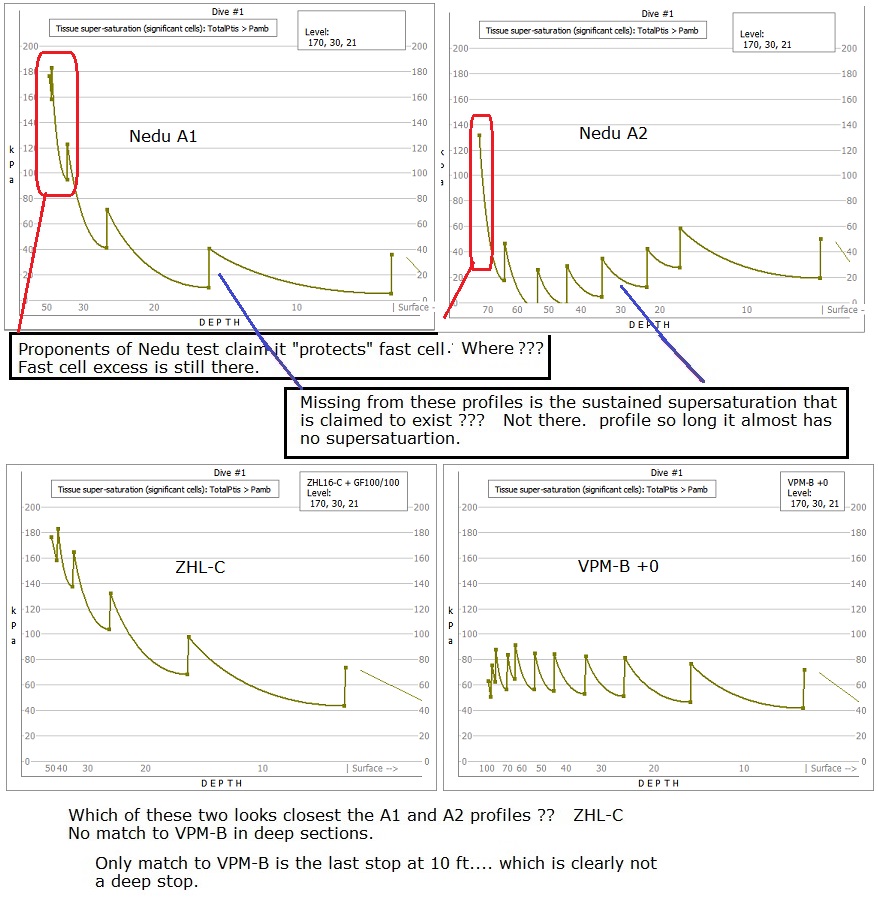
On / off gassing make pretty charts, but is NOT decompression information.
No. Supersaturation is not measured by comparing it to a neighbors value. These chart has no decompression details.
- The colors compare the state of each tissue compartment's supersaturation and continued on gassing relative to the other 4 profiles. So, for example, compartment 10 for A2 is red when the diver surfaces while the other profiles' are shades of red and yellow. The colors roughly show how close each profile's compartment is to the others.
***********************************
Here is a real chart of actual decompression supersaturation limits. This data (actual supersaturation) is superior to on/off gassing data.
Last edited:
")