App for deco levels

Please register or login

Welcome to ScubaBoard, the world's largest scuba diving community. Registration is not required to read the forums, but we encourage you to join. Joining has its benefits and enables you to participate in the discussions.

Benefits of registering include

  • Ability to post and comment on topics and discussions.
  • A Free photo gallery to share your dive photos with the world.
  • You can make this box go away

Joining is quick and easy. Log in or Register now!

Rickk

Contributor
Messages
339
Reaction score
367
Location
Philippines
# of dives
500 - 999
I have an idea for either an app or an Excel spreadsheet to be used in Tech training.

What I would like to do is create, a spreadsheet at first, perhaps an app later, that would allow you to enter a dive profile, and then step through it minute by minute of your dive showing the N2 concentrations in each tissue compartment. It would be useful in tech training to allow divers to visualize how N2 is absorbed and eliminated over the course of a dive. The leading tissue compartment could be highlighted a if a compartment was on or off-gassing could also be indicated.

First question, Is there already such an app? I do not want to reinvent the wheel for this.

I am thinking that the display would be a bar chart, showing N2 levels in each of the 16 compartments, critical compartment highlighted in one colour, on-gassing compartments in another and off-gassing compartments in a third colour. You could step through the dive in one minute increments, and reverse through the dive as well. The N2 levels could also be shown for a time post dive to show how N2 is eliminated post dive. It would also allow for use of deco gases in various concentrations. I would start with air and nitrox only, but would consider adding in Trimix later.

Second question. Does anyone see a use for this? Would it be beneficial in training new tech divers?

Third question, What features and functions would you like to see in such a spreadsheet or app?
 
Deep Tools seems to have what you want. Drag on the profile graph to show the tissue bars on the bottom. The plan is a bit cluttered for my taste (so I don't use it), but it seems to be under development.

Screenshot_2024-11-12-17-05-33-31_9277a7cd124a6d4f3c21a10cead0e2be.jpg
 
What I would like to do is create, a spreadsheet at first, perhaps an app later, that would allow you to enter a dive profile, and then step through it minute by minute of your dive showing the N2 concentrations in each tissue compartment. It would be useful in tech training to allow divers to visualize how N2 is absorbed and eliminated over the course of a dive. The leading tissue compartment could be highlighted a if a compartment was on or off-gassing could also be indicated.
I think (quite sure actually) you can do that in subsurface desktop version
I was able to import a dive profile from previous logs and you can edit sample points (depth, gas/set point (ccr)…)

In the plot side you can activate the extra overlays for surfGF, TTS, and tissue loading

Lemme get to a pc and get you some screenshots
EDIT:
After you have a dive imported into your log book just click Log > Edit in Planner to use it in the edit mode; or just plan a fresh one Log > Plan Dive

Normal log book view looks like this

1731460413523.png


Planner mode looks like this (dragable sample points in the graph is really helpful)
1731460561005.png


Edit2:
This feature isn’t available on the mobile version of subsurface, Maybe if you wanna still contribute some code, they could use help porting the parts that didn’t (probably impossible w/o completely refactoring, it might be a Herculean task)

Edit3: ignore my whacky (log) example, this is a ccr dive with some setpoint changes that translated wrongly as gas changes, the original log even registers as OC 🤦🏽‍♀️ (but the good thing is you can edit it in pos)t; but it’s the only log i tried that feature on (I was looking at tissue loading and surfGF values vs Setpoint choices for variations on that profile)
 
Second question. Does anyone see a use for this? Would it be beneficial in training new tech divers?
I think it would help a great deal, I consider myself very lucky I saw my 1st tissue loading heatmap (in a @Dr Simon Mitchell lecture on YT) BEFORE doing DecoPro class, so that lecture allowed me a great advantage digesting and visualizing the theory before class

If that can be done (even simpler plots, no heat maps needed) on phone, so that hypothetical dive plans can be discussed between students and instructors would be awesome tbh
I haven’t tried the app @inquis suggested yet, but might also fit the bill

Third question, What features and functions would you like to see in such a spreadsheet or app?
Well..
Heatmap (for tissue loading),
Touch to plot a dive profile,
ability to change GF in post (this is a more complex idea I was hoping to try with subsurface but no luck):
Import/“plan” only the “bottom” part of the dive, and calculate the deco stops based on that (I wanna see how various GF will impact it)
 
ability to change GF in post
Subsurface can do that. Edit the downloaded dive in the planner, and just delete points from the end in the profile table. I suggest youn either export before editing (so you can restore the actual dive) or work in a temporary dive log file.
 
I am not thinking about an app that will analyze a dive, but one that will show N2 loading by tissue compartments for a defined dive profile.

I am thinking of it being more of a teaching aid useful for intro level deco courses.

Think of the tissue loading graph in the bottom row of a Perdix, on a but with more info and the ability to step forward and backward through the dive.
 
something that would be useful in planning is to have a visual display of N loading/deco obligations and CNS and then adjust the gas mixes to see how that changes the outcomes - this may be already in subsurface - i dont know

you can do this jus try resetting values in an app but a side by side comparison would be interesting
 
Think of the tissue loading graph in the bottom row of a Perdix, on a but with more info and the ability to step forward and backward through the dive
Yeah that’s is something that subsurface does already, just not “beautiful”
You step through the dive by hovering over the time step/sample you wanna be at
It doesn’t show N2 loading per tissue (and not plotted), but the ceiling of the tissue translates to N2 loading (how close to super saturation limits is that tissue at)

The heat map on the other hand I find much better ar visual representation, but it does has a bit of a “getting used to” curve

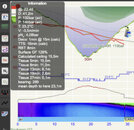
Again, it aint pretty in Subsurface (screenshot), but you can do it for a logged dive or a planned hypothetical dive

a stepper UI would be for sure better than that, and probably simpler to implement that rather than a full deco planner- I’d be interested for sure to see other apps than subsurface to do such a feature 😅
Doing it on phone is also more “training” suitable I gotta admit
 

Attachments

  • F7585791-42CE-4C01-8433-7C8669ABBA59.jpeg
    F7585791-42CE-4C01-8433-7C8669ABBA59.jpeg
    285.4 KB · Views: 66
I created an app (still a work in progress) that does what I think you're asking for. You build out your dive plan and it generates a few pretty graphs, one of which is tissue loading (one graph for nitrogen, and another one for helium). DiveIntelligence

NOTE: will not render on mobile (or any small screen devices).

1731517068595.png


1731517082067.png


1731517091998.png
 

Back
Top Bottom